Data Analysis with MS Excel (LIVE Batch No- 17)
সম্পর্কে অবশ্যই
Advanced Data Analysis With MS Excel এর ১৭ তম ব্যাচে এনরোল করলেই থাকছে ৪০% ডিস্কাউন্ট অফার
— — —
** আপনি যদি ফর্মূলা মুখস্ত না করে এক্সেল শিখতে চান, তাহলে কোর্সটি আপনার জন্য
** কোর্সটি খুবই Advanced Module নিয়ে সাজানো হয়েছে
** Excel দিয়ে যারা অনেক দ্রুত এবং দক্ষতার সাথে কাজ করতে চান তাদের জন্যই এই কোর্স
— — —
১ম থেকে ১৬ তম ব্যাচে মোট শিক্ষার্থী সংখ্যা: ২০৭(+) জন
— — —
ক্লাস কবে এবং কখন হবে?
Academic Class শুরু হবেঃ ৮ ডিসেম্বর, ২০২৪
সিডিউলঃ রবিবার এবং মঙ্গলবার (সপ্তাহে ২ দিন)
সময়ঃ ৯ঃ৩০ – ১০ঃ৩০ (রাত)
ক্লাস সংখ্যাঃ ১২ টি
— — —
এই কোর্সে আপনার জন্য বিশেষ কি থাকছে?
MS Excel এমন একটি যুগান্তকারী Tool এর নাম যার প্রয়োজন হয় সকল পেশার মানুষের। এমনকি আপনি যদি একজন শিক্ষক, ছাত্র অথবা উদ্যোক্তা হোন তাহলেও এই software টির Advanced ব্যবহার আপনাকে নিয়ে যাবে অনন্য মাত্রায়।
– সনামধন্য ইন্ডাস্ট্রি এক্সপার্ট তানভীর স্যার প্রতিটি ক্লাস নিবেন। যার আছে ৫ বছরের টিচিং এবং বিভিন্ন প্রতিষ্ঠানে কাজ করার অভিজ্ঞতা
– মুখস্ত না করে সকল কৌশল বুঝে বুঝে শিখার সুযোগ
– প্রজেক্ট বেইজড লার্নিং
– Exam এর মাধ্যমে নিজেকে মূল্যায়ন
– লাইভ ক্লাসের পাশাপাশি রেকর্ডেড ক্লাস ভিডিও সাপোর্ট
– লাইফটাইম FB Group + WhatsApp Group সাপোর্ট
– বিশাল Alumni গ্রুপে জয়েন হওয়ার সুযোগ
– Software – MS Office 21
– কোর্স শেষে সার্টিফিকেট
— — —
আমাদের কোর্সের Review দেখতে চাচ্ছেন?
Review Link: https://www.facebook.com/logicprodigybd/reviews
Live Class Review: https://www.youtube.com/playlist?list=PLqbaeenFBgAEXhuhBVJ5Y4LKss–mQfMF
— — —
Course Outline:
Topics
1. Pivot Table
2. Power Pivot Table
3. DAX
4. Dynamic Dashboard
5. Developer Tool for Creative and Analytical Dashboard
6. Power Query
7. Predictive Data Analysis
8. Macro
9. Career Guideline
Class wise outline
Lecture- 01
- How to install Excel 21
- Brief Discussion of Data
- Interface Idea of Pivot Table
- Making Reports with Pivot Table
——————-
Lecture- 02
- Multiple Reports and Formatting
- Uses of Calculated Fields
- Classic Pivot Table Layout & Filtering
- Data Visualizations and Formatting
- Dynamic Presentation with Slicer
——————-
Lecture-03
- Understanding Data for Power Pivot Table
- Activation of Power Pivot Table
- Data Modeling
- Data Visualizations and Formatting
- Dashboard Creation
——————-
Lecture-04
- Introduction of DAX
- Details of DAX
- Difference Between Calculated Column and New Measure
- Benefits of DAX
- Discussion on RELATED DAX
——————-
Lecture-05
- Logical Functions: IF, Nested IF
——————-
Lecture-06
- Detailed Discussion on DAX
- Discussion of CALCULATE Function
- Integration of CALCULATE Function with ALL, ALL SELECTED & ALLEXCEPT
——————-
Lecture-07
- CALCULATE & Multiple Filters
- Integration of CALCULATE with Filter Function
- Integration of CALCULATE with Greater Than Filter Function
——————-
Lecture-08
- Activation of Developer Tool
- Uses of Buttons for Analytics
- Dynamic Dashboard using Developer Tool
——————-
Lecture-09
- Details of Power Query
- Data Importation using Power Query from Different Source
——————-
Lecture-10
- Advanced Data Transformation with Power Query in Details (Basic to Advance)
——————-
Lecture-11
- Discussion on Statistical Theory Regarding Predictive Analysis
- Linear Regression & Modeling
——————-
Lecture-12
- Macro with Absolute Reference
- Macro with Relative Reference
——————-
Lecture-13
- Review Class
- Test Examination
— — —
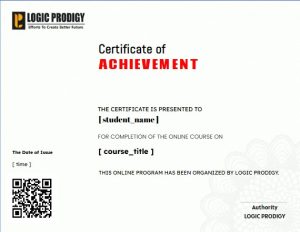
আমাদের ডেমো সার্টিফিকেটঃ

ছাত্র রেটিং ও পর্যালোচনা

